Green Town, by Friedensreich Hundertwasser. Image Source.
As a follow up to last week’s post about Madrid, this week we present different paths being pursued by cities to become “green.” Such efforts are undertaken mostly under the banner of climate adaptation (and occasionally mitigation), but notions of what it actually means to be “green” often depend on a mix of problem definition, perceived political feasibility, and varying visions of desired future conditions. Far from a neutral term, “green city” means different things to different cities for different reasons. Several examples are presented below.
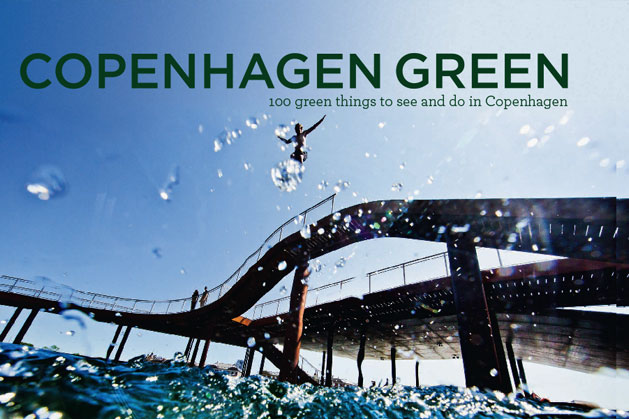
Copenhagen. Image Source
Leading the Green Economy
While the very idea that economic growth can be green is a contested one, many cities are using economic arguments to justify environmental measures. Scandinavian capitals Copenhagen, Stockholm, and Oslo are frequently cited as best practice examples, and Copenhagen was named the greenest city in the world in 2016 by Dual Citizen, Inc., a consulting firm responsible for The Global Green Economy Index.
“The Global Green Economy Index™ (GGEI) measures both the green economic performance of 80 countries and how experts assess that performance. The GGEI performance index uses quantitative and qualitative indicators to measure how well each country performs on four key dimensions: leadership & climate change, efficiency sectors, markets & investment and the environment. Then, the GGEI perception survey collects assessments from expert practitioners on these same four dimensions. You can download the new 5th edition of the GGEI by clicking here.
“The GGEI was the first index of its kind, launched in 2010, and today is widely referenced and utilized by policymakers, international organizations, civil society and the private sector. Like many indices, the GGEI is used to benchmark performance, communicate areas that need improvement, and show diverse stakeholders how they too can promote progress. The GGEI is particularly relevant today as countries aiming to realize new emission reduction and sustainable development goals will require data and insight to identify the best pathways to a low carbon economy.”
“Cities and measuring their green economic performance has not been a focus in the GGEI in past editions. This is by no means due to their lack of importance. Sub-national actors – ranging from cities to regions, states and large companies – are playing increasingly central roles in the quest to reorient growth towards greener pathways. Instead, the limitation to developing a full green city index to mirror the national one has been due to a lack of data availability. Unlike countries where reporting and coverage of main topics and themes can be more complete, the same cannot be said for cities, where large data gaps exist and no standardized reporting on important indicators related to the green economy have been established.
“On the perception side, the GGEI has collected data from our survey respondents on how they judge city performance on the main four dimensions of the GGEI: leadership & climate change, efficiency sectors, markets & investment and the environment. In the 2016 edition, the GGEI collected these perceptions for 50 cities. These perception results – while lacking the comparability to performance like in the national index, are still valuable. They show the extent to which urban “green brands” are developing. They also indicate cases where the city green brand may be stronger than the national one, suggesting ways to leverage this to attract greater interest and investment to the country as a whole.” Read more at dualcitizeninc.com.
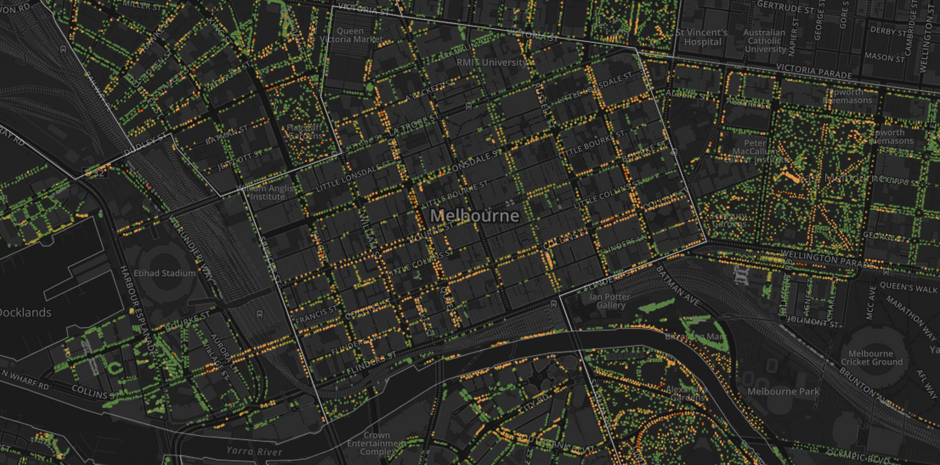
Urban Forest Visual, City of Melbourne. Image Source.
Bringing the Forest to the City
Melbourne, Australia, is seeking to become a green city by realizing a massively ambitious yet incredibly commonsense plan: their Urban Forest Strategy. Australia has even made available a free, step-by-step, how-to guide for other cities to follow.
“The City of Melbourne is facing the significant challenges of climate change, population growth and urban heating, placing pressure on the built fabric, services and people of the city. A healthy urban forest will play a critical role in maintaining the health and liveability of Melbourne.
Our Urban Forest Strategy seeks to manage this change and protect against future vulnerability by providing a robust strategic framework for the evolution and longevity of Melbourne’s urban forest.
The strategy aims to:
- adapt our city to climate change
- mitigate the urban heat island effect by bringing our inner-city temperatures down
- create healthier ecosystems
- become a water-sensitive city
- engage and involve the community.
We will achieve this by:
- increasing canopy cover from 22 per cent to 40 per cent by 2040
- increasing forest diversity with no more than five per cent of one tree species, no more than ten per cent of one genus and no more than 20 per cent of any one family
- improving vegetation health
- improving soil moisture
- improving biodiversity
- informing and consulting with the community.”
Read more about Melbourne’s Urban Forest Strategy here and check out its interactive Urban Forest Visual website here.
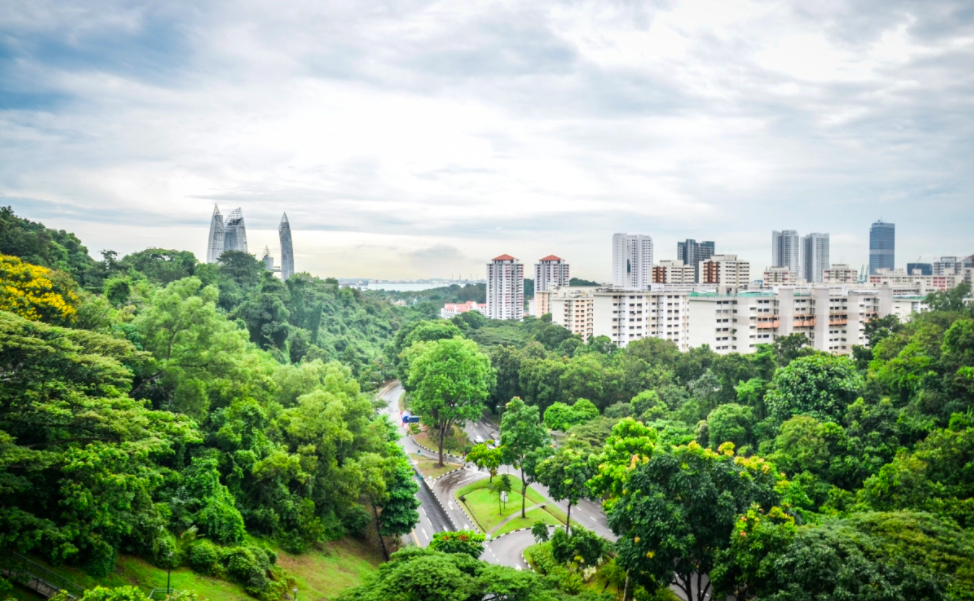
Singapore. Image Source.
According to Google Street View
Then there’s always the technological approach, which in this case is rather straightforward. Simply treat the images generated by Google Street View as an army of volunteers and devise an algorithm to measure perceived greenness from street-level. The greenest city in the world? Singapore.
“Forget counting parks – a database of urban greenery ranks cities based on how leafy they look to residents.
Researchers are already using satellite imagery to estimate the number of trees in cities, but Newsha Ghaeli, a research associate at MIT’s Senseable City Lab, wanted to analyse residents’ perspectives. She called her analysis Treepedia. ‘It’s important to understand the amount of trees and canopy cover from the street, as that’s what we perceive to be in cities,’ Ghaeli says.
To create the greenery maps, Ghaeli’s team feed images from Google Street View into an algorithm that estimates what percentage of each image consists of trees. Plotting these scores on a map determines the leafiness of street.
The results can be combined to give each a Green View Index (GVI) – Ghaeli’s rating of how leafy each city is on a street level. Singapore tops the table with a GVI of 29.3 per cent with Sydney and Vancouver close behind. At the greyer end of the scale, Paris scores a paltry 8.8 per cent.
Lower amounts of city greenery have been linked with higher stress levels, so the analysis may offer health insights. ‘We’re working on cities in Asia and Australia,’ Ghaeli says – but she can only analyse areas with Street View images, which rules out China and India.” Keep reading at wired.co.uk.